
Media Mix Modelling (MMM) was built specifically to close that gap. But while the term gets used freely in strategy conversations, what it actually does and how to act on its outputs is frequently misunderstood.
This article explains how MMM works mechanically, what it can and can't measure, and how to translate its outputs into concrete budget decisions.
Key Takeaways
- MMM uses regression analysis on historical data to estimate each channel's contribution to sales or conversions
- It decomposes total sales into base volume (what you'd sell without advertising) and incremental volume (what advertising drove)
- Adstock and saturation transformations are what make MMM reflect how advertising actually works in practice
- MMM informs strategic budget allocation, not real-time campaign optimisation
- Its outputs are correlational, not causal. Validation requires pairing with incrementality testing
What Is Media Mix Modelling?
MMM is a statistical analysis technique that uses historical data on marketing spend, external conditions, and business outcomes to estimate how much each media channel contributed to a chosen KPI, typically sales, leads, or conversions.
You'll see it called both "media mix modelling" and "marketing mix modelling," and major platforms like Meta Robyn and Google Meridian use the terms interchangeably. There is a practical distinction, though: media mix modelling typically refers to paid advertising channels specifically, while marketing mix modelling can include broader commercial drivers like pricing, distribution, and promotions.
How It Differs From Multi-Touch Attribution
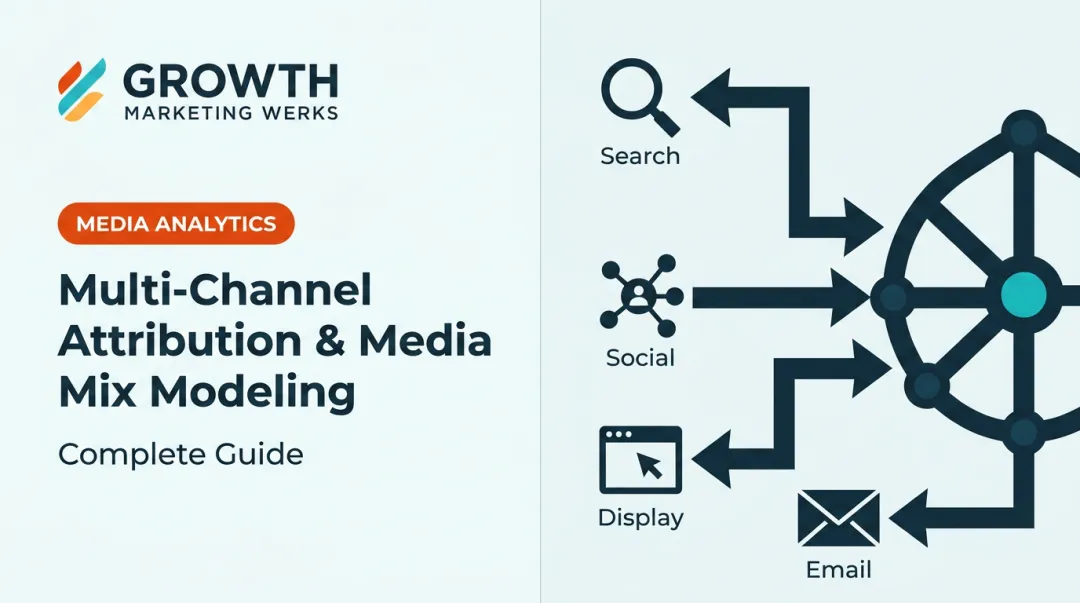
MMM and multi-touch attribution (MTA) answer related but different questions:
| Dimension | MMM | Multi-Touch Attribution |
|---|---|---|
| Data level | Aggregate, channel-level | Individual user-level |
| Time horizon | Historical (2–3 years) | Real-time or near-real-time |
| Channel coverage | All channels, including offline | Digital touchpoints only |
| Best use | Strategic budget allocation | Digital path-to-conversion analysis |
| Privacy dependency | None (no individual tracking) | Requires cookies or device IDs |

They're complementary. MMM tells you how to set the annual media mix; MTA tells you how a digital prospect moved through the funnel.
Why Brands Use MMM and What It Measures
The core problem MMM solves: when a company runs five or six channels simultaneously, standard performance dashboards can't isolate what each channel truly caused. Platforms double-count, offline effects disappear, and time-lagged impacts go undetected. According to Analytic Partners' 2025 ROI Genome Flash Report, 35 cents are lost for every $1 spent when brands optimize using siloed metrics.
The Base/Incremental Split
MMM decomposes total sales into two components:
- Base volume: sales that would occur naturally due to brand strength, seasonality, pricing, and economic conditions, regardless of advertising
- Incremental volume: sales directly attributable to marketing activity
This split matters because without it, you can't know whether strong sales figures reflect the quality of your advertising or simply your existing brand momentum. A channel that appears to correlate with revenue might just be running during a season when you'd have sold well anyway.
What MMM Measures Beyond Channel Spend
This breadth is what separates MMM from channel-specific reporting:
- Ad timing and frequency effects
- Impact of price changes and promotions
- Competitive advertising activity
- Seasonal and economic patterns
- The interaction effects between channels
Why MMM Is Gaining Relevance Now
Those measurement gaps have grown harder to ignore as privacy restrictions tighten. IAB's 2024 State of Data report confirmed that privacy changes and signal loss have permanently altered addressability and measurement in digital advertising. Forrester finds 68% of marketers are currently reevaluating their third-party data partnerships as a result.
MMM benefits directly from this shift because it operates on aggregate, historical data and requires no individual tracking pixels or cookie-based attribution. That makes it structurally resilient to privacy changes that erode other measurement approaches.
How Media Mix Modelling Works
MMM is a regression model. It takes a dependent variable (typically weekly sales or leads) and models it as a function of multiple independent variables: spend per channel, seasonality indicators, promotions, competitive pressure, and economic conditions. The output is a set of coefficients representing each variable's estimated contribution to the outcome.
Two non-linear transformations make the model realistic:
Adstock: Accounting for Carry-Over Effects
Advertising doesn't affect sales only in the week it runs. A TV spot seen on Monday may influence a purchase made three weeks later. Adstock functions model this decay rate so the model captures lagged impact, not just same-week spend.
In Meta Robyn's implementation, the decay parameter theta controls this. A value of 0.75 means 75% of the previous period's advertising effect carries forward, which is a useful illustration of the mechanic, though actual decay rates vary by channel, creative, and audience.
Saturation: Modelling Diminishing Returns
The first dollars spent on a channel typically produce the greatest return. As spend increases, each additional dollar yields less incremental sales. Google Meridian describes this as "the nonlinear relationship where additional media has changing, often diminishing, marginal impact."
Modelling this saturation curve is critical for identifying where a channel is overfunded (you're on the flat part of the curve) versus where it still has headroom.
The Three-Step MMM Process
Step 1: Data Collection and Preparation
Gather and clean historical spend data across all active channels, aligned to the same time granularity as your sales data. Weekly is best practice: Meta Robyn recommends at least two years of weekly data, while monthly data requires four to five years for comparable reliability.
Layer in control variables:
- Seasonality patterns
- Promotions and price changes
- Economic indicators and competitive pressure
This step is where most errors originate. Gaps, outliers, and inconsistent reporting periods degrade model accuracy before modelling even begins.
Step 2: Model Building and Calibration
Apply regression modelling with adstock and saturation transformations for each channel's spend variable. Run multiple iterations to find the specification that best explains historical sales trends while remaining statistically sound. Validate against a held-out portion of historical data (backtesting) to confirm the model generalizes beyond its training period.
Step 3: Interpreting Outputs and Running Scenarios
Read the model's output as a decomposition of total sales, showing what percentage came from base volume versus each channel. Use channel-level ROI estimates to identify over- and under-performing investments. Then run "what-if" budget scenarios to simulate how reallocation would affect predicted outcomes before committing spend.

How to Put MMM Insights to Work in Your Media Strategy
Translating Outputs Into Budget Decisions
The model's saturation curves tell you exactly where you stand on the diminishing returns curve for each channel. That's where the actionable decision lives:
- Pull back on channels where the saturation curve has flattened, because additional spend is producing minimal incremental return
- Invest more in channels where marginal return is still high, meaning you haven't reached the saturation point yet
- Reallocate from over-invested channels toward under-invested ones based on relative marginal return estimates, not absolute ROI alone
The Analytic Partners data makes the stakes concrete: their ROI Genome research finds that paid search accounts for only 16% of sales on average, while brand and other marketing activities drive 25%, yet siloed measurement routinely overstates paid search's contribution and understates brand investment's impact.

MMM's Place in the Planning Cadence
MMM answers strategic allocation questions, not tactical ones. The appropriate cadence:
- Quarterly or semi-annually: to inform planning cycles and annual media mix decisions
- Not weekly or monthly: MMM is not designed for bid adjustments or real-time optimisation. That's where platform-native tools and campaign management systems operate
MMM sets the portfolio strategy. In-campaign tools handle daily execution.
Pairing MMM With Incrementality Testing
MMM establishes correlation-based estimates. Confirming causation requires controlled experiments such as geo-based holdout tests or incrementality studies that measure actual lift from specific channels or campaigns. The two approaches triangulate toward a more reliable picture: MMM for broad channel strategy, incrementality tests to validate causal lift for high-spend or high-uncertainty channels.
Where Strategic Advisory Adds Value
Statistical outputs don't make budget decisions. People with strategy-first media expertise do. Translating a saturation curve into a defensible reallocation recommendation requires understanding what those numbers mean in the context of a specific channel's creative environment, competitive landscape, and funnel role.
That interpretation gap is where advisory work earns its value. Growth Marketing Werks uses Datorama to connect channel-level performance data to revenue outcomes, identifying where spend shifts based on pipeline contribution rather than ad platform reporting. Their flat-fee structure removes the incentive to recommend higher spend simply because it inflates billings.
Limitations and Common Misconceptions About MMM
MMM Does Not Prove Causation
This is the most consequential misconception. MMM identifies correlations in historical data that suggest channel contributions. It does not prove that a channel caused sales to increase. Marketers who treat MMM outputs as definitive proof risk flawed budget decisions, particularly when historical spend patterns across channels are highly correlated (making it difficult for the model to separate their effects).
Short-Term Bias Toward Direct Response
MMM measures what happened in weekly sales data. Channels like broadcast TV or out-of-home advertising can carry long-term brand equity effects that take months or years to register in revenue, and those effects won't appear clearly in a regression model.
Analytic Partners finds that brand marketing outperforms performance marketing 80% of the time in its ROI Genome research, yet MMM-optimized budgets can systematically undervalue brand investment by focusing on short-term sales effects. Treat that structural blind spot as a known input when interpreting results, not a reason to discard the model.

When MMM Produces Unreliable Results
Avoid relying on MMM outputs when:
- Historical data is too short: less than two years of weekly data (or less than four to five years of monthly data) significantly reduces reliability
- Spend patterns are highly correlated: if you always increase TV and digital spend at the same time, the model can't separate their effects
- A new channel has insufficient history: Meta Robyn explicitly recommends excluding variables that lack sufficient variation and volume in the dataset
- Major market disruptions occurred: a global event, a significant competitor entry, or a major business model change breaks the patterns the model was trained on, and those disruptions need to be modelled explicitly as control variables rather than treated as normal media response
Frequently Asked Questions
What is the media mix modelling framework?
MMM is a regression-based statistical framework that models the relationship between marketing spend and business outcomes like sales, using historical time-series data. It estimates each channel's contribution, accounting for carry-over effects and diminishing returns, then produces outputs that inform budget allocation decisions.
Is MMM the same as econometrics?
MMM is a specific application of econometric methods. Econometrics is the broader discipline of applying statistical techniques to economic data; MMM refers specifically to using those regression techniques on marketing and media data to measure advertising effectiveness and guide budget decisions.
What is an example of a media mix?
A brand running spend across paid search, connected TV, paid social, and out-of-home advertising has a four-channel media mix. MMM would analyze historical performance data to show which channels drove the most incremental sales and whether the current budget split is producing the best possible return.
How much data do you need for media mix modelling?
Meta Robyn's guidance sets the minimum at two years of weekly data for robust results, with monthly data requiring four to five years. Data quality matters as much as volume. Gaps, missing channels, or inconsistent reporting periods can significantly reduce model accuracy regardless of dataset length.
What is the difference between media mix modelling and multi-touch attribution?
MMM operates at the aggregate channel level using historical data and doesn't track individual users, making it suitable for all channels including offline. Multi-touch attribution tracks individual digital user journeys across touchpoints. MMM suits strategic budget planning across the full media mix; MTA suits understanding the digital path to conversion.
How often does a media mix model need updating?
Refresh MMM outputs quarterly or semi-annually, or whenever there is a meaningful change in your media mix, market conditions, or business model. Modern Bayesian approaches allow more frequent updates, but traditional MMM is not built for real-time use. It's a planning tool, not an optimisation engine.